




High-level results
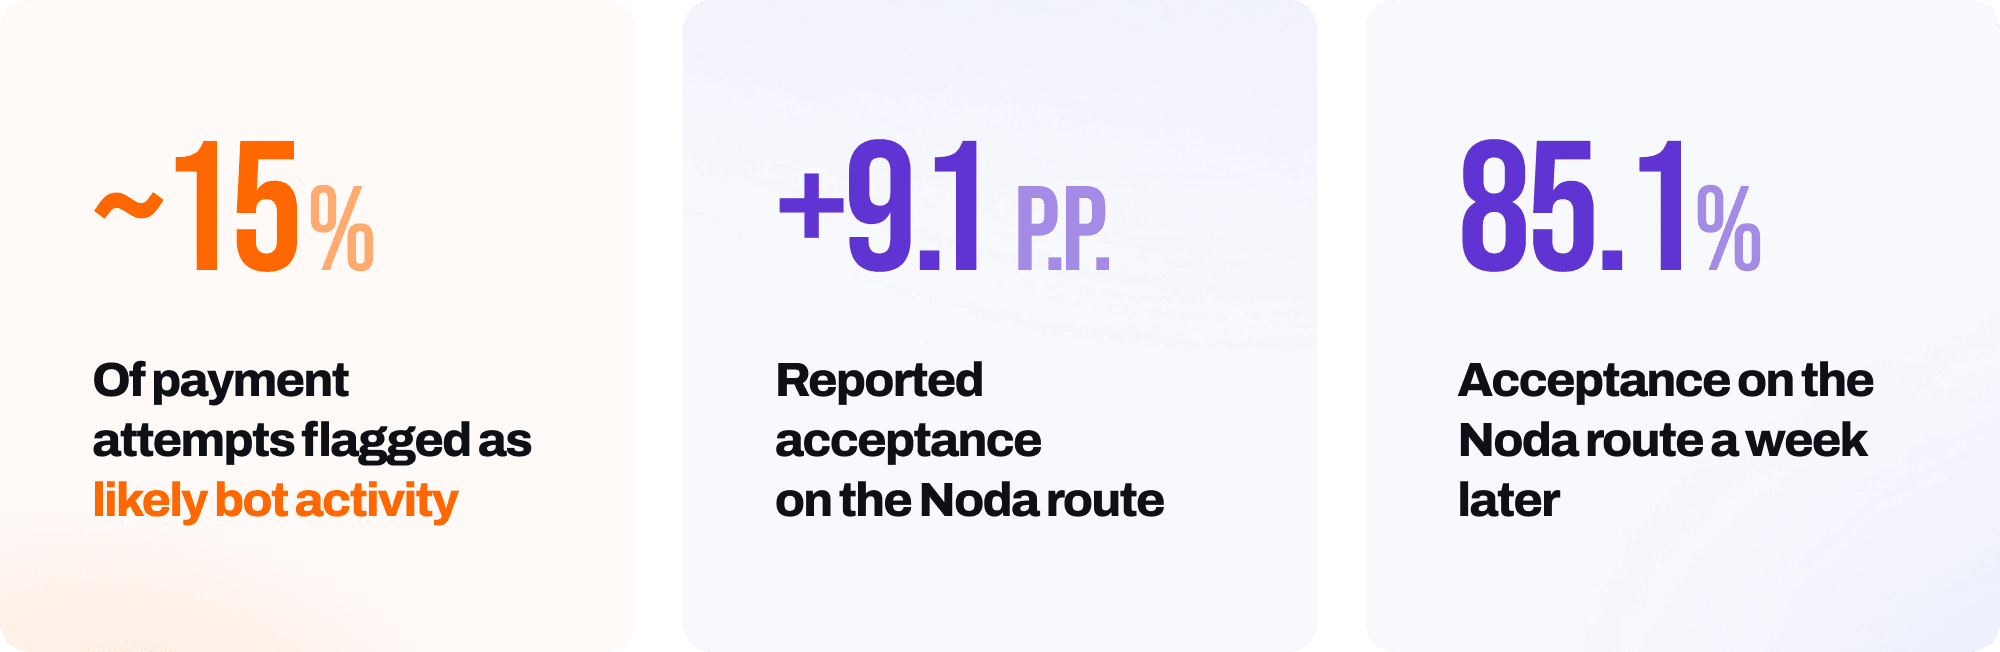
- ~15% of the merchant's payment attempts identified as likely bot activity, about 8× the level seen across other Noda merchants, The profiles were handed to the merchant for review;
- +9.1 p.p. in reported acceptance on the Noda route once that activity dropped, with no change needed on the payment side;
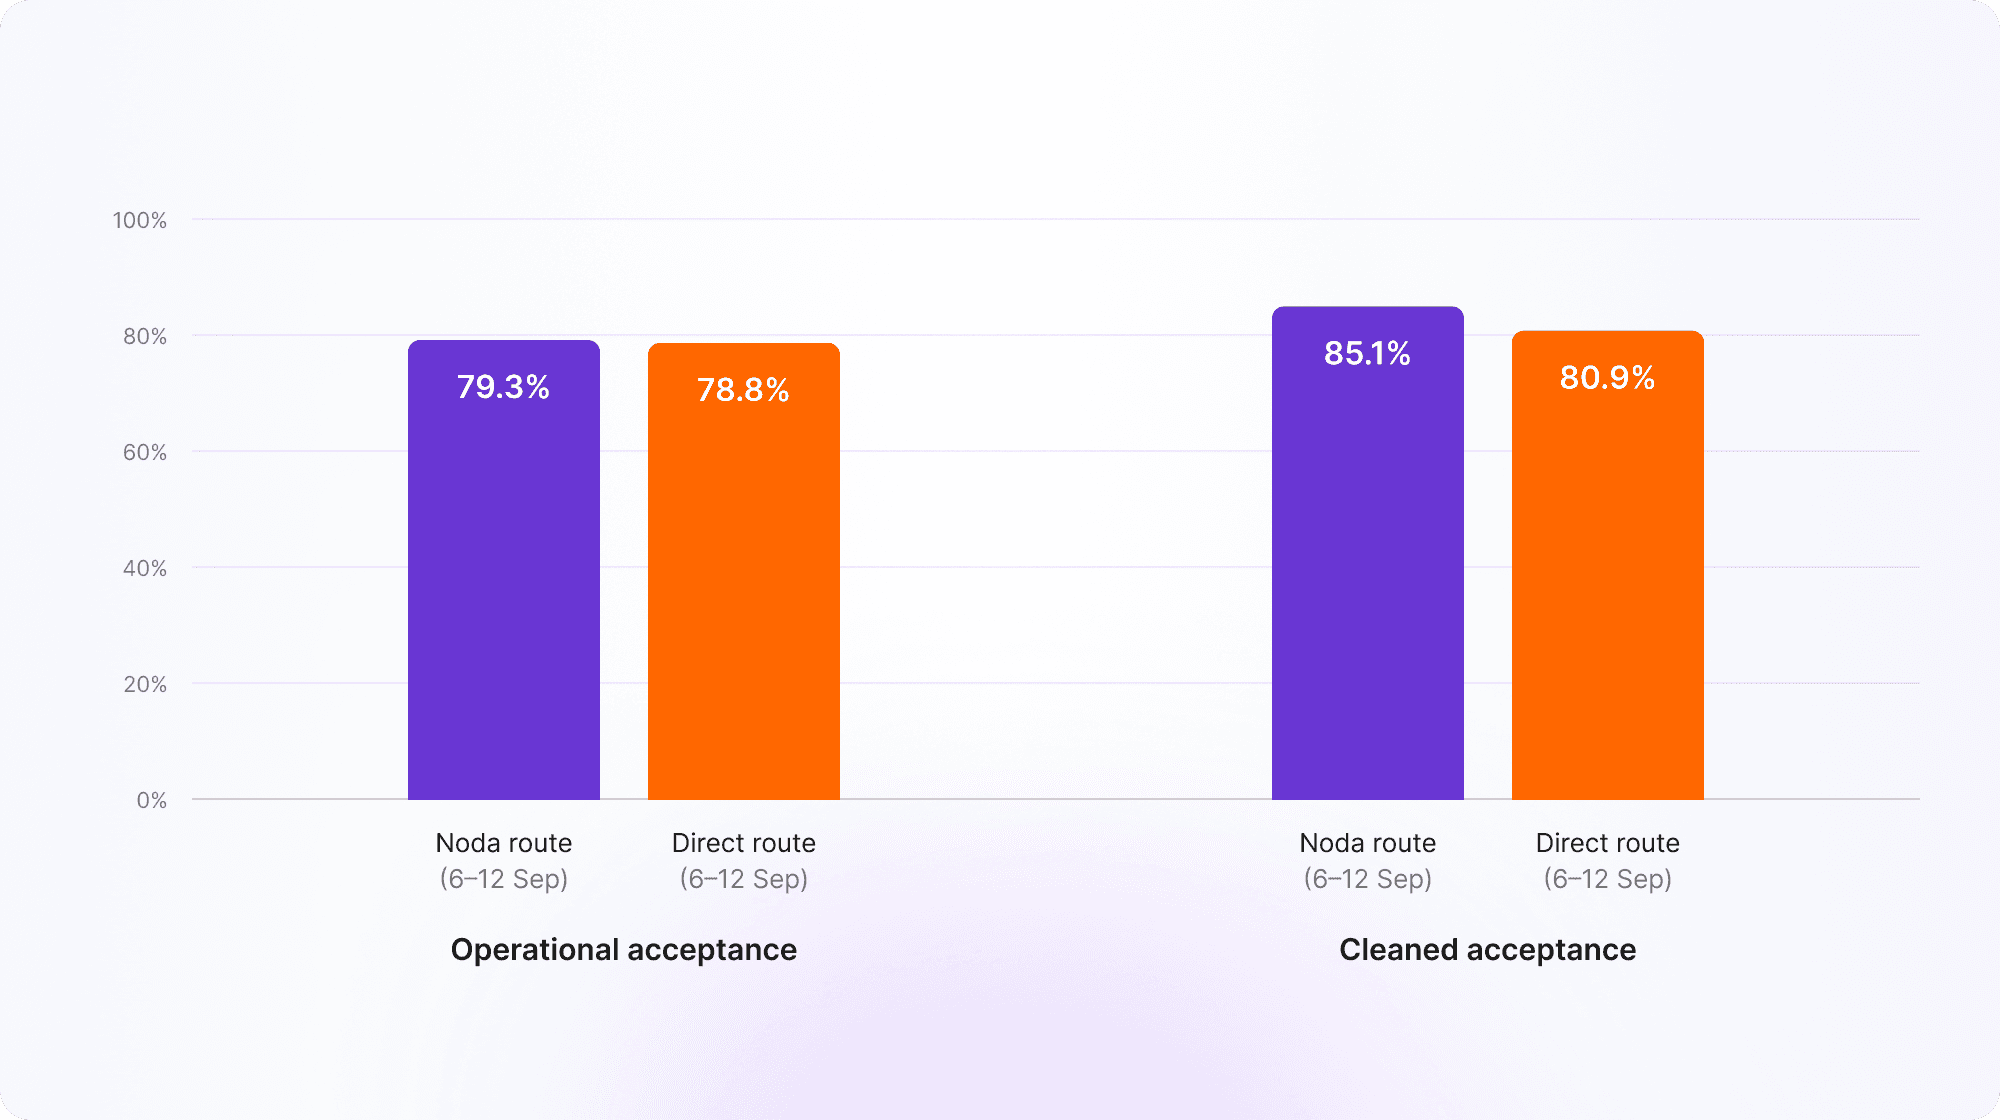
- 85.1% vs 80.9% acceptance in favour of the Noda route when repeat attempts are counted as one payment.
The challenge: one of the payment routes underperformed
The merchant ran two open banking setups side by side. One brand received payments to the merchant's own direct IBAN. Another brand received them to a Noda-provided IBAN.
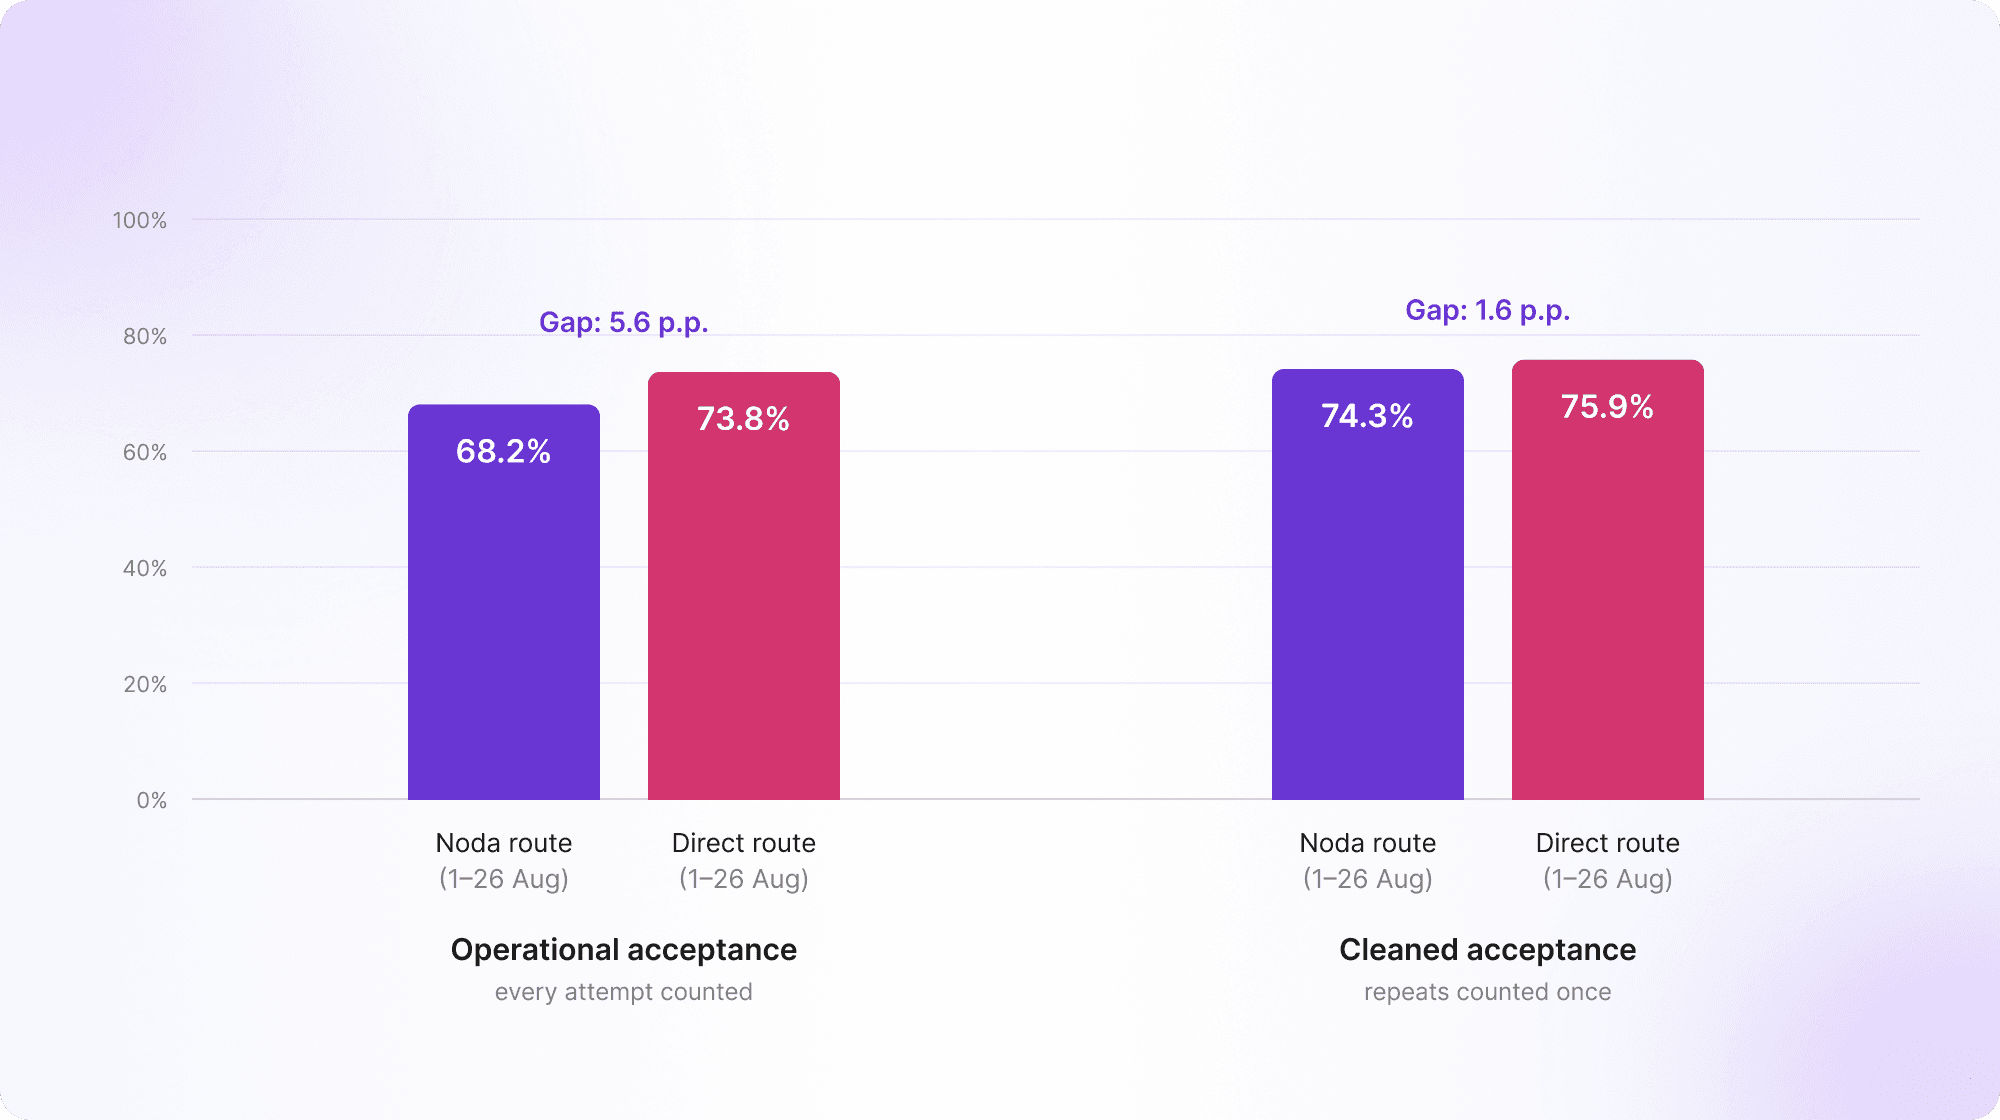
Over roughly four weeks, the Noda route was clearly behind. Its acceptance rate was 68.2%, against 73.8% on the direct route, a gap of 5.6 percentage points.
For an iGaming operator, deposit acceptance translates directly into revenue. So the natural conclusion was simple: the Noda setup performs worse. Before accepting that, our team wanted to know what exactly sat behind the number.
Because the two routes served different brands, a raw comparison could reflect differences in players as much as in payment performance. So before drawing conclusions, we looked at who, or what, was behind the attempts.
What Noda did: followed every payment attempt, not just the total
1. Looked at what was inside the failed attempts
We started by splitting failed payments into groups. One group stood out immediately: attempts where a payment link was created, but the payment never went any further.
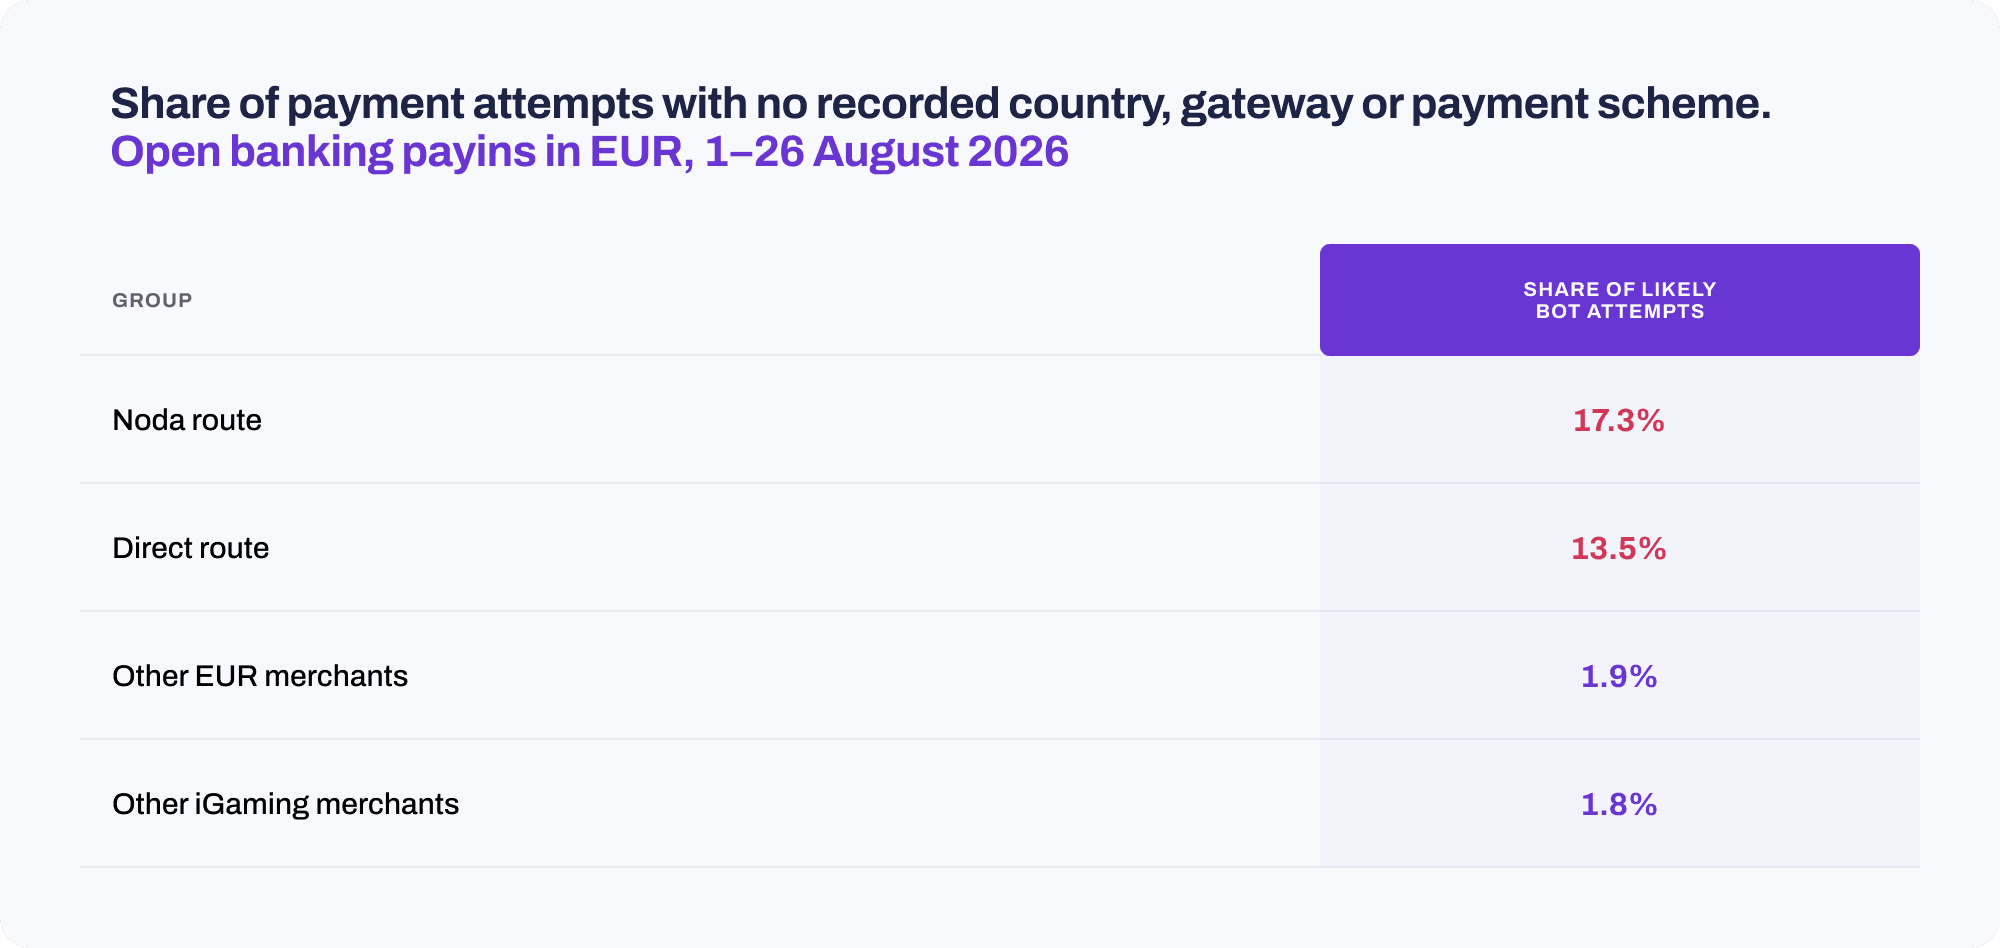
These attempts only added to the total count and pulled acceptance down. On the Noda route they made up 17.3% of all attempts, compared with 13.5% on the direct route.
2. Checked whether a real person was behind them
Next, we went through server logs and payment form events for every one of these attempts. Out of almost 2,600 such attempts on the Noda route:
- almost all had a payment link successfully created,
- only 18 showed any interaction with the payment page,
- none showed a payer choosing how to pay,
- nearly all simply expired after about two hours.
In other words, the payment links were created but practically never opened. That rules out a technical failure on the bank side as the main cause.
3. Compared the merchant with the rest of our traffic
If this were normal behaviour, we would see it everywhere, but we don't. Across this merchant, such attempts were about 15% of the traffic. Across other Noda merchants in the same currency, they were under 2%, and the picture was the same for other iGaming merchants.
4. Found the pattern behind the repeats
Just 15 profiles created 37% of these attempts, some up to 76 a day, often every 10–15 seconds. Regular, dense series like this are typical of scripts, not people. We classified this activity as likely bots.
5. Measured how much of the gap it explains
With the same share of likely bots as the direct route, the Noda route would have reached 71.3%. One factor explained about 56% of the gap. Bank by bank, removing likely bots moved the Noda route ahead.
Why there are two acceptance numbers
Acceptance rate can be counted in two ways, and in this case the difference mattered.
Operational acceptance rate counts every attempt: five tries and one payment is 20%.
Cleaned acceptance rate groups a payer's repeat attempts within 24 hours into one payment intent, showing how many people who wanted to pay actually did.
Because bots generate repeats, the gap looked much bigger on an operational basis (5.6 p.p.) than on a cleaned one (1.6 p.p.).
The result: once the bots dropped off, the Noda route caught up and moved ahead
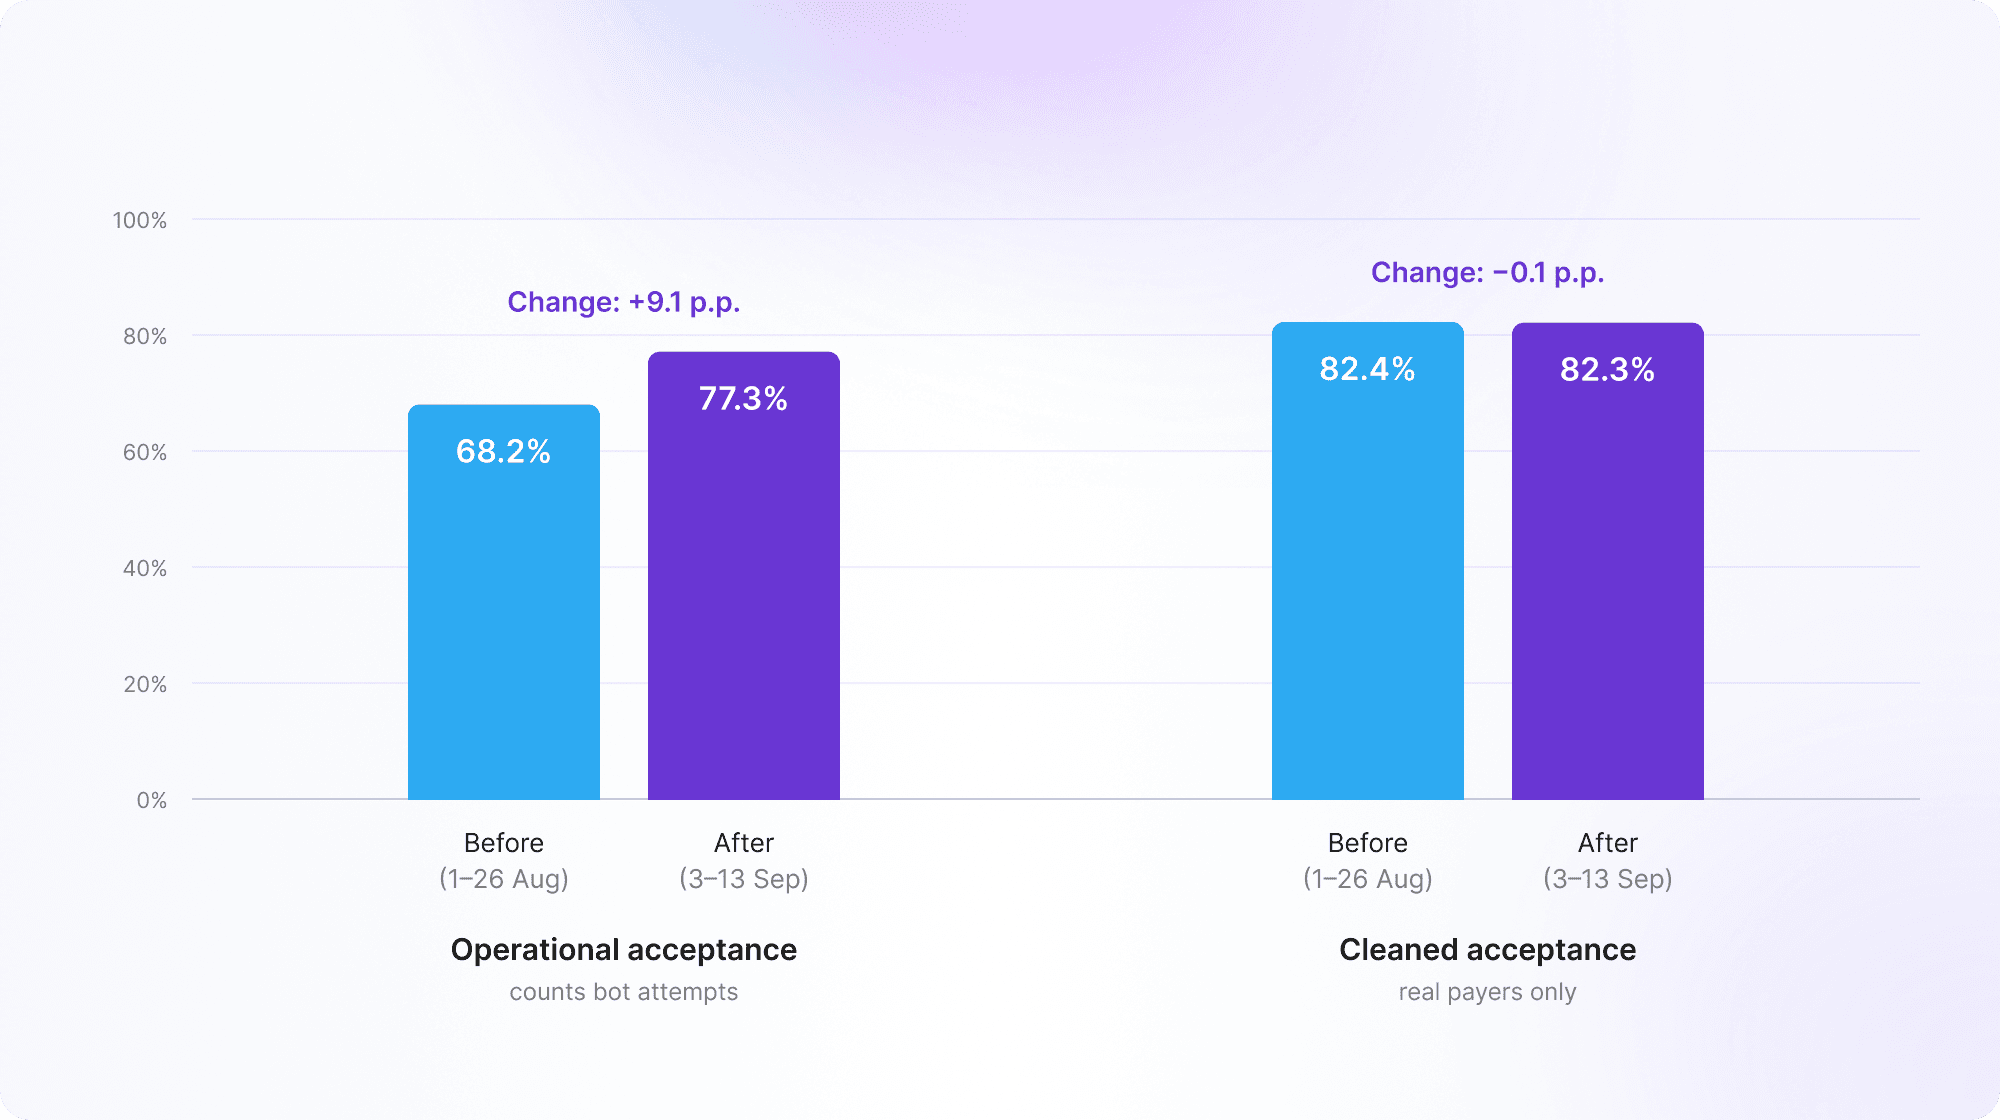
Shortly after the analysis period, the automated activity dropped sharply. Likely bot attempts on the Noda route fell from 17.3% to 6.7%, and the 15 most active profiles all but disappeared.
Acceptance rose because bots left, not because payments changed
Overall acceptance on the Noda route rose from 68.2% to 77.3%. Acceptance among real payers stayed flat at about 82%, so the entire increase came from fewer bots.
The Noda route caught up and moved ahead
In the following week of 6–12 September, the two routes were level on operational acceptance, and the Noda route led on cleaned acceptance: 85.1% vs 80.9%.
The route was performing as expected; most of the gap came from the traffic.
The bigger lesson: how you count acceptance changes what you see
A single acceptance rate mixes many things: the bank, the setup, the payer and the quality of the traffic itself. Two routes can show very different numbers for reasons that have nothing to do with how well they process payments.
In this case, the easy answer was "switch all traffic to the direct route". The right answer was in the logs: thousands of payment attempts that no real person ever opened.
We shared the findings with the merchant, including the profiles behind most of the automated attempts, and are now working together on traffic quality so that real players get through and scripted attempts don’t distort the numbers.
Read More Case Studies

How a high-volume iGaming merchant lifted open banking acceptance by 7% with Noda IBAN

How one travel company took the stress out of travel booking for its customers